Add bold column with totals
Contents
Add bold column with totals#
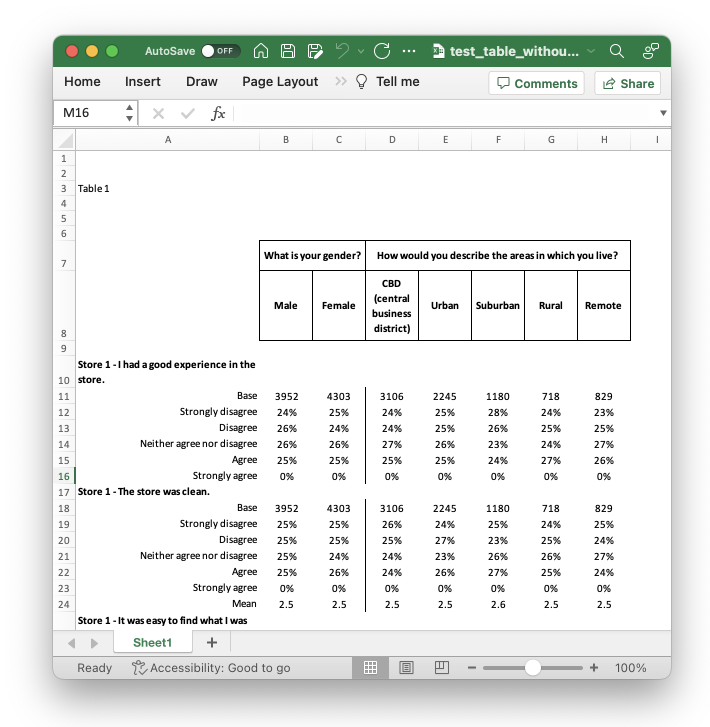
By default, the Excel outputs are simple black text, without formatting. The most basic output can be generated like this:
ds = tally.DataSet(api_key=token, host=api_url, ssl=use_ssl)
ds.use_spss('my_file.sav')

build = tally.Build(name='Client A', default_dataset=ds)

sheet = build.add_sheet(banner=['gender', 'locality'])
sheet.add_table(stub={'x' : 'q14r01c01'})
sheet.add_table(stub={'x' : 'q14r02c01', 'stats':['mean']})

build.save_excel('test_table_without_formatting.xlsx')
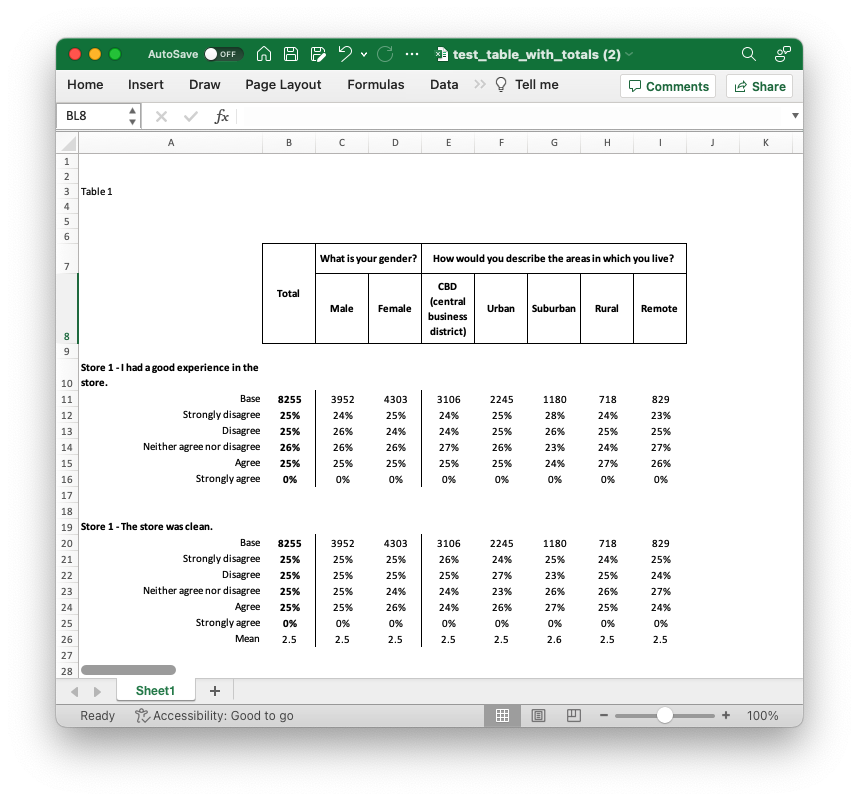
Add a total column and format it#
To add a total column to a data table, we need to add an option to the stub that defines the table. This can be one on a table-by-table bases
sheet.add_table(stub={'x' : 'q14r01c01', 'xtotal':True})
But below we want to apply it to the entire sheet, so we add it to the sheet options. In both the sheet and build options, we can add extra options to the stub, to save us from adding it to every single table definition.
Then, we use set_column_format_for_type and add a format for both the base type and percentage type so that the formatting will apply to our whole column.
The result is an excel table with a total column in bold.
ds = tally.DataSet(api_key=token, host=api_url, ssl=use_ssl)
ds.use_spss('mydata.sav')

build = tally.Build(name='Client A', subtitle="Datasmoothie", default_dataset=ds)

sheet = build.add_sheet(banner=['gender', 'locality'])
sheet.options.set_stub({'xtotal': True})
sheet.options.set_column_format_for_type('base', 1, {"bold":True})
sheet.options.set_column_format_for_type('percentage', 1, {"bold":True})

sheet.add_table(stub={'x' : 'q14r01c01'})
sheet.add_table(stub={'x' : 'q14r02c01', 'stats':['mean']})
sheet.add_table(stub={'x' : 'q14r03c01'})

build.save_excel('test_table_with_totals.xlsx')