Formatting bases in Excel
Contents
Formatting bases in Excel#
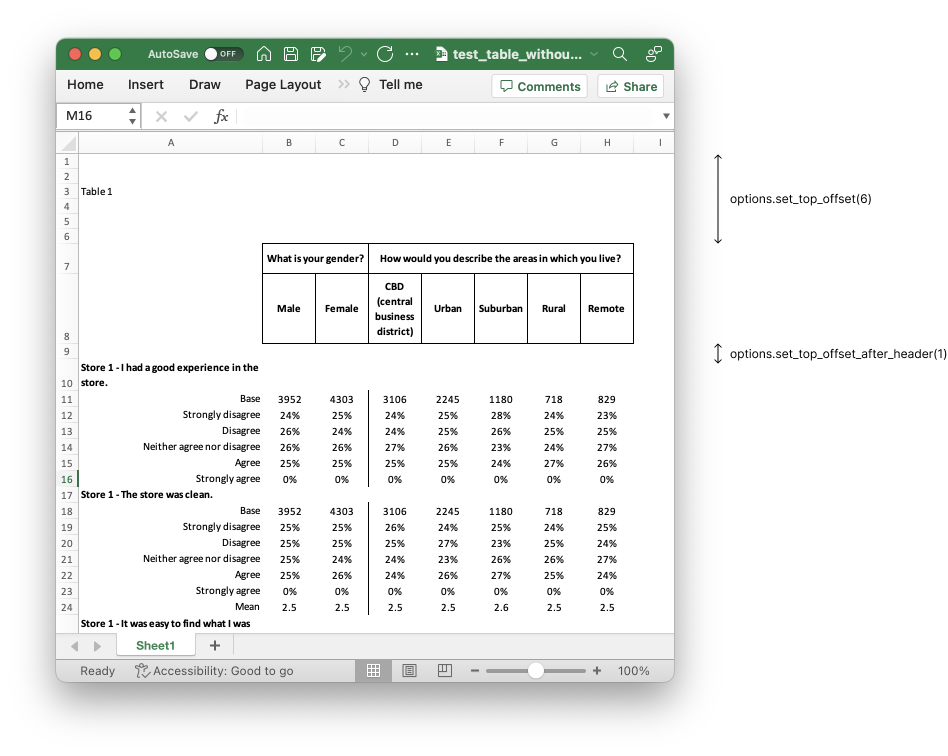
The default format of the header and bases of a data as generic as possible. The text is black, there’s room for the logo above the table, and the table name is at the top. To generate a table without any visual customisations, we can run:
ds = tally.DataSet(api_key=token, host=api_url, ssl=use_ssl)
ds.use_spss('my_file.sav')

build = tally.Build(name='Client A', default_dataset=ds)

sheet = build.add_sheet(banner=['gender', 'locality'])
sheet.add_table(stub={'x' : 'q14r01c01'})
sheet.add_table(stub={'x' : 'q14r02c01', 'stats':['mean']})

build.save_excel('test_table_without_formatting.xlsx')

Move base above table and give it a border#
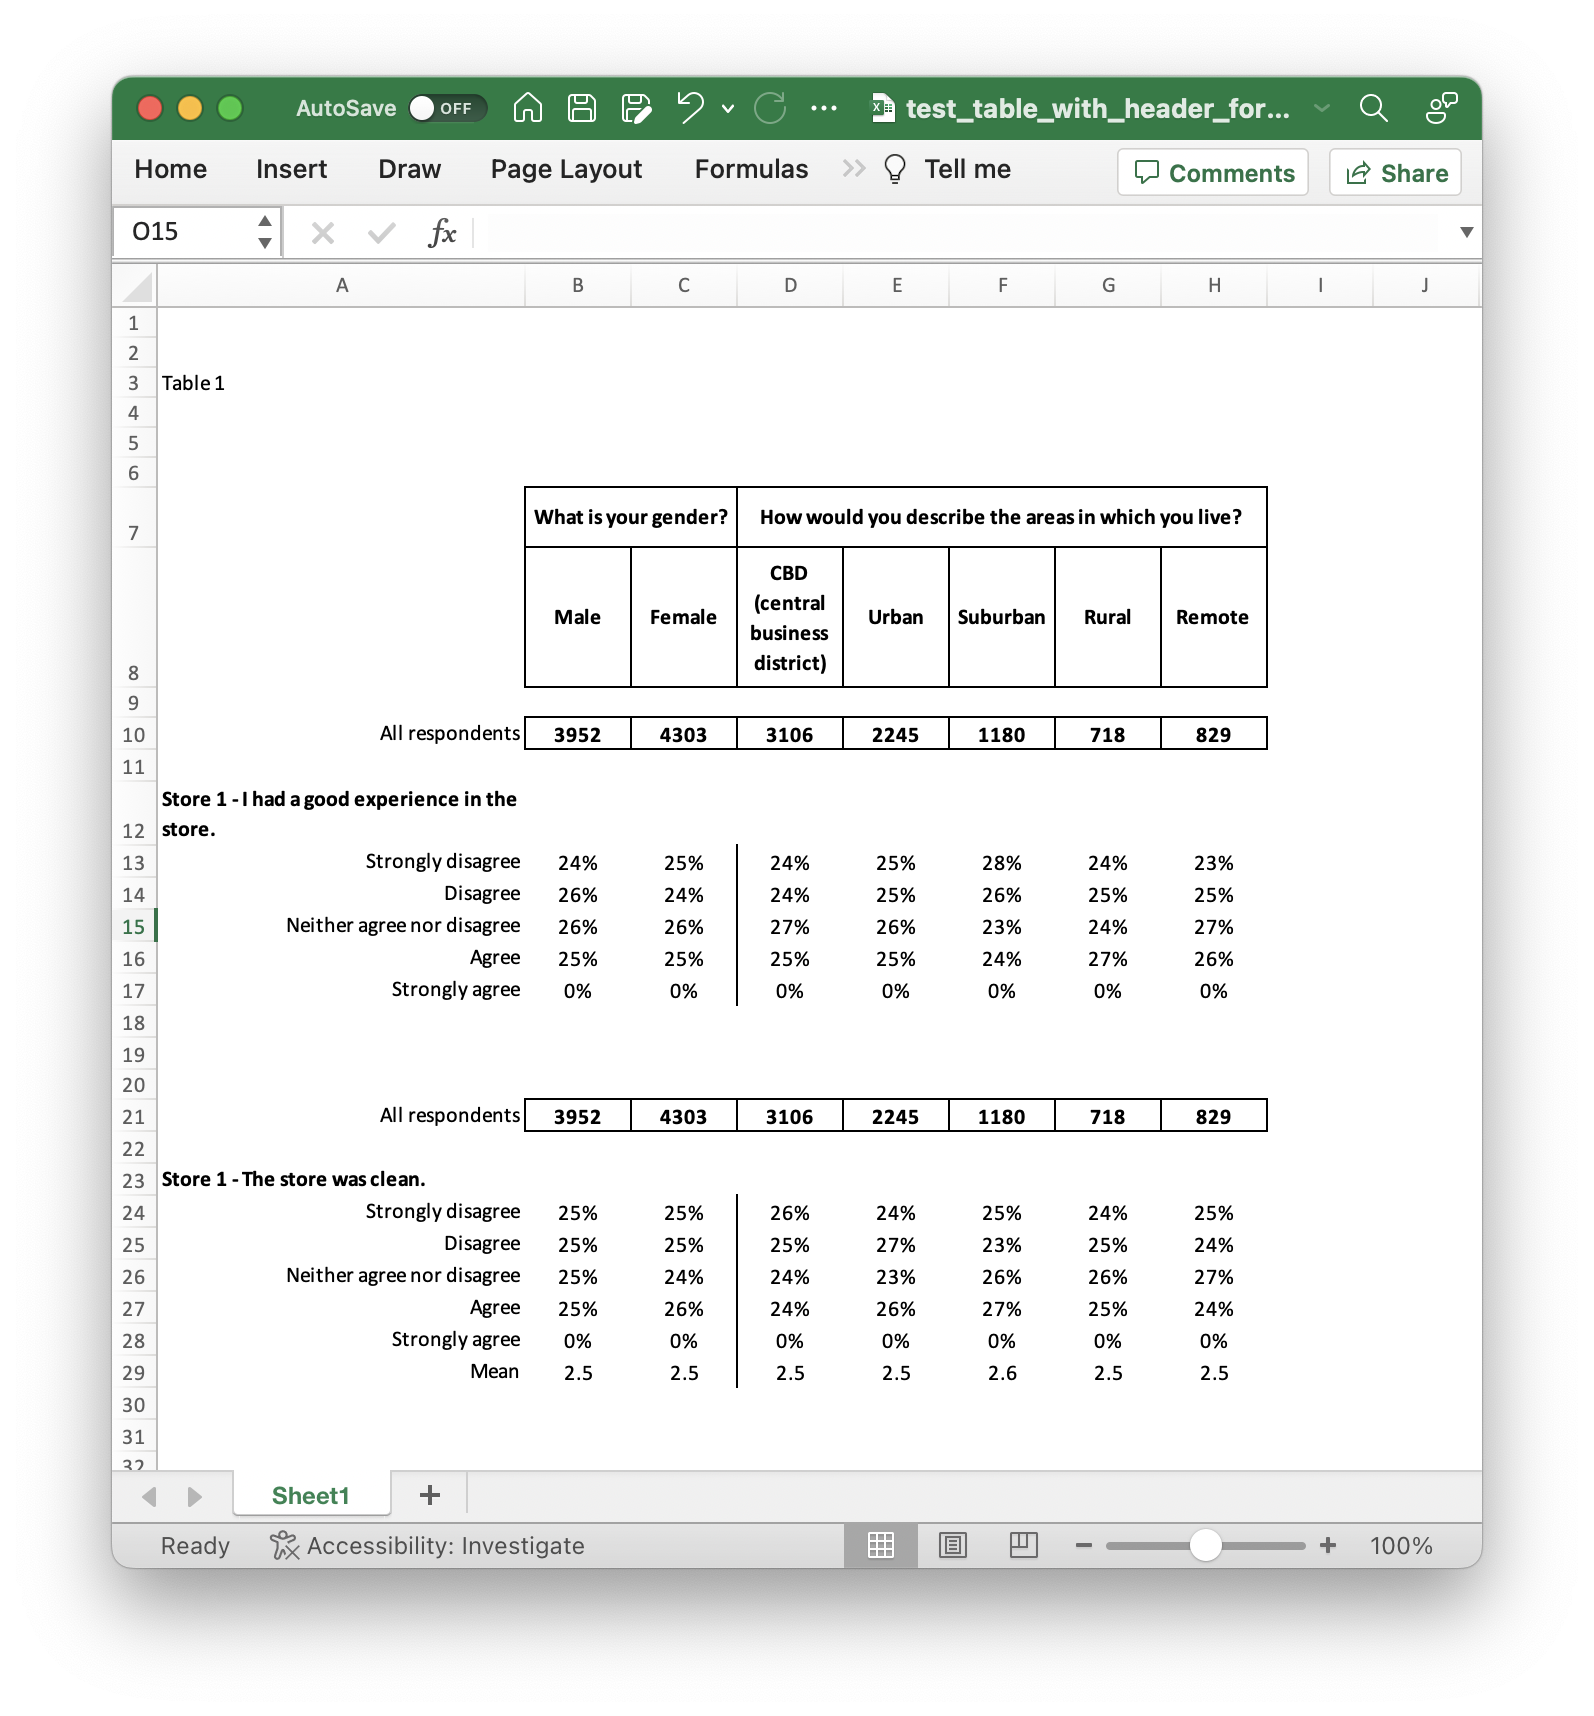
We want to show the base before we show any data, and we also want a border around the base numbers. We also want to describe what our base was, so we change the base label.
ds = tally.DataSet(api_key=token, host=api_url, ssl=use_ssl)
ds.use_spss('myfile.sav')

build = tally.Build(name='Client A', subtitle="Datasmoothie", default_dataset=ds)
build.options.set_top_offset_after_header(1)

sheet = build.add_sheet(banner=['gender', 'locality'])
sheet.options.set_base_position('outside')
sheet.options.set_format('base', {'bold':True, 'border': 1, 'border_color':'000000'})
sheet.options.set_base_labels("All respondents")

sheet.add_table(stub={'x' : 'q14r01c01'})
sheet.add_table(stub={'x' : 'q14r02c01', 'stats':['mean']})
sheet.add_table(stub={'x' : 'q14r03c01'})


build.save_excel('test_table_with_header_formatting.xlsx')
