Tally SDK documentation
Contents
Tally SDK documentation#

Use Python to integrate multiple survey data platforms, perform data processing tasks, and build Excel tables, Powerpoint presentations and dashboards.
Tally is a tool for survey and market research data processing, analysis, and publishing. It allows users to combine multiple survey data platforms, run data processing tasks such as cleaning, weighting, merging data and creating new variables. It also produces Excel data tables, Powerpoint files and interactive dashboards.
Tally is composed of two parts:
A RESTful API
A Python client library for the API
Because Tally is based on an API, it supports R, JavaScript and any other programming language. It can also be plugged into a data warehouse pipeline, where it can both be used as an ETL layer and an OLAP layer for survey data.
Creating a survey data pipeline#
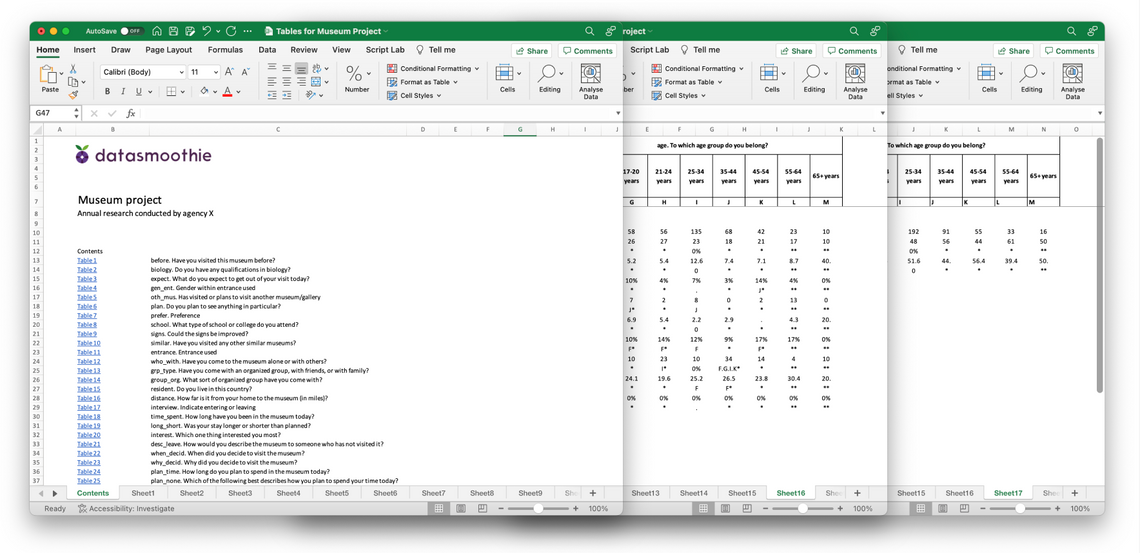
Building Excel tables#
The Tally Python SDK makes it easy to build Excel outputs with full, fine-grained control over looks and contents. To read more about building Excel tables, refer to the section about building outputs and the API reference on the Build, Sheet and Options objects.